
A Look Into the Markets
The "Santa Claus Rally" in stocks is an often-discussed phenomena in the markets, but it was the bond market that has displayed some holiday cheer this year. Let's discuss what happened last week and look into the final trading days of the year.
"All I Want for Christmas" - All I want for Christmas - Mariah Carey
Crazy 8's
In late October 30-yr mortgage rates hit 8%; the highest in this century. Since that time, the bond market has been on a tear with rates declining for 8 consecutive weeks.
Reasons for the sharp decline:
1. Inflation moving lower.
2. Anticipating the Fed is done hiking rates.
3. Labor market is loosening up.
4. Oil prices have declined sharply.
5. Fears of recession are throughout the globe.
6. Israel/Hamas war and uncertainty.
3rd Quarter GDP in the Books
U.S. Gross Domestic Product (GDP), like many economic reports, issues multiple readings before submitting a final report. In the case of GDP there are three reports. Last Thursday, the final reading for 3rd quarter GDP was released and it came in at a strong 4.9% clip. The market took the good news in stride. Why? Because of the 3rd quarter which ended in September. This means the markets are not paying much attention to the backward-looking reasons and are more focused on where the economy is headed. The Atlanta Fed GDP
Now, which had been accurately forecasting the strong GDP reading for the 3rd quarter, is currently forecasting 4th quarter GDP to come in at 2.7% or roughly half the pace of the 3rd quarter. So the economy is indeed slowing and is a reason why the Fed's next move is to cut rates.
3.84%
If the 10-yr Note yield finishes the year beneath 3.84%. Rates will be lower on the year, which is a crazy thought after the historic spike late summer.
Bottom line: The bond market is finishing off the year in fine fashion and interest rates will be right where the year began. Except, unlike this year where the Fed hiked rates, they will be cutting in 2024.
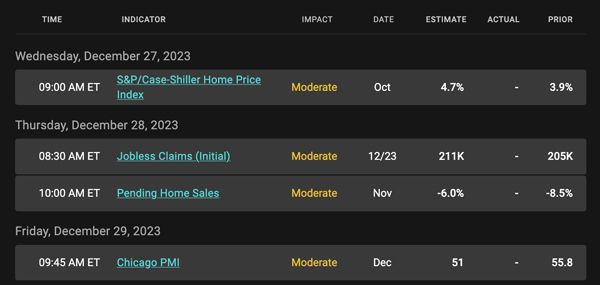
Looking Ahead
Next week should be quiet, there are a bunch of moderate impact economic releases, which should not move the markets too much. But what could derail the party is a series of Treasury auctions. If the appetite for the bonds is not good, rates could rise. The opposite is true.
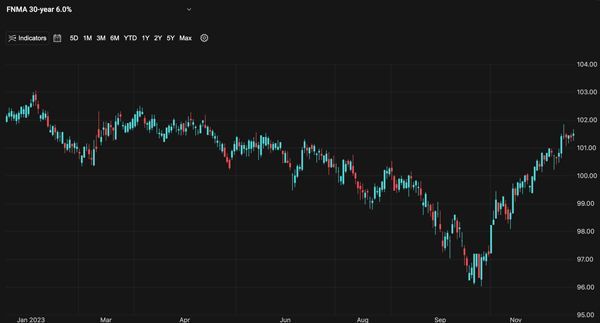
Mortgage Market Guide Candlestick Chart
Mortgage bond prices determine home loan rates. The chart below is a one-year view of the Fannie Mae 30-year 6.5% coupon, where currently closed loans are being packaged. As prices move higher, rates decline, and vice versa.
On the far-right side of the chart, you can see how prices have gone straight up for eight consecutive weeks making for the wonderful decline of 8% 30-yr loans to something in the 6's%.
Chart: Fannie Mae 30-Year 6.5% Coupon (Friday, December 22, 2023)
Economic Calendar for the Week of December 25 - 29
The material contained in this newsletter has been prepared by an independent third-party provider. The content is provided for use by real estate, financial services and other professionals only and is not intended for consumer distribution. The material provided is for informational and educational purposes only and should not be construed as investment and/or mortgage advice. Although the material is deemed to be accurate and reliable, there is no guarantee it is without errors.
As your mortgage professional, I am sending you the MMG WEEKLY because I am committed to keeping you updated on the economic events that impact interest rates and how they may affect you.
Mortgage Market Guide, LLC is the copyright owner or licensee of the content and/or information in this email, unless otherwise indicated. Mortgage Market Guide, LLC does not grant to you a license to any content, features or materials in this email. You may not distribute, download, or save a copy of any of the content or screens except as otherwise provided in our Terms and Conditions of Membership, for any purpose.

